Should overpronators buy stability shoes?
We test the most repeated piece of shoe-store advice against our review data by asking whether satisfaction and injury rates among overpronators differ in neutral vs. stability shoes.
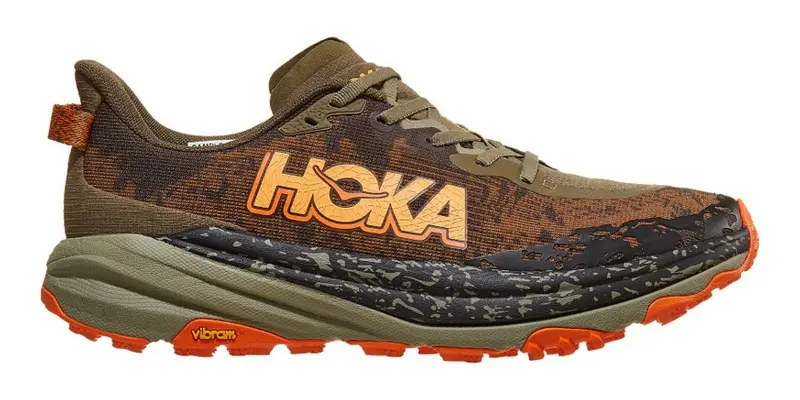
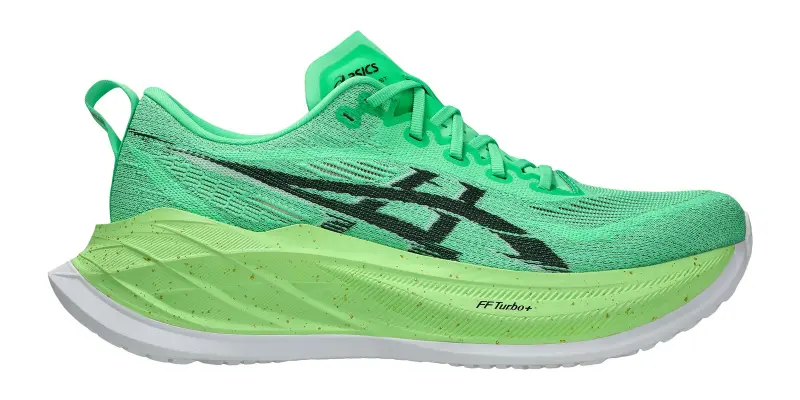
Top-rated neutral shoes
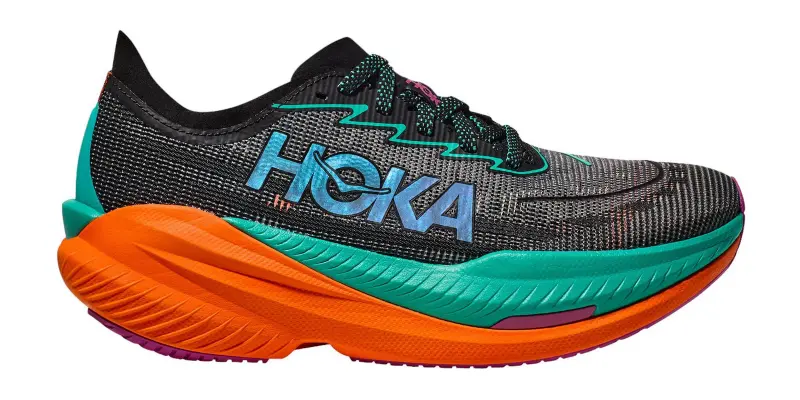
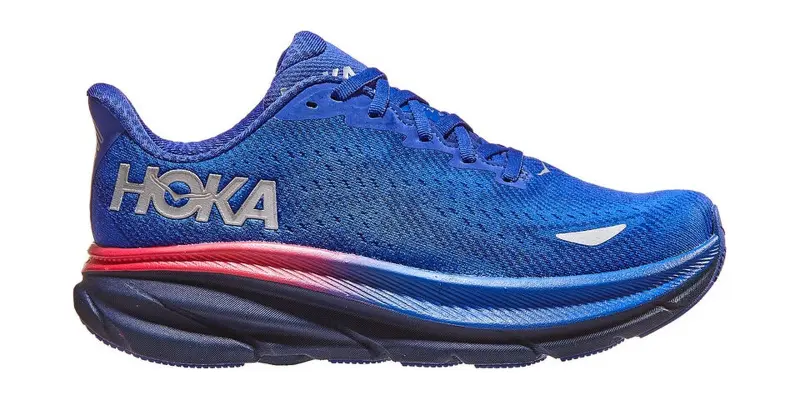
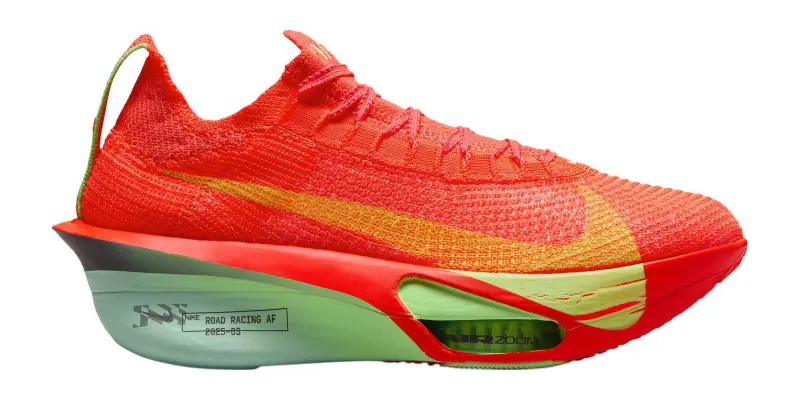
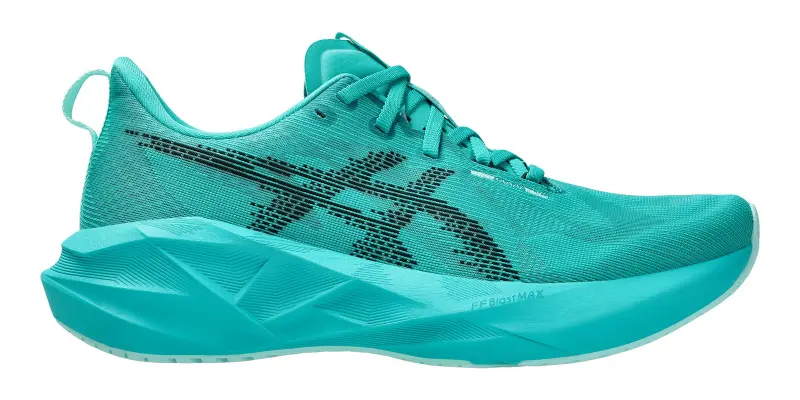
Top-rated stability shoes
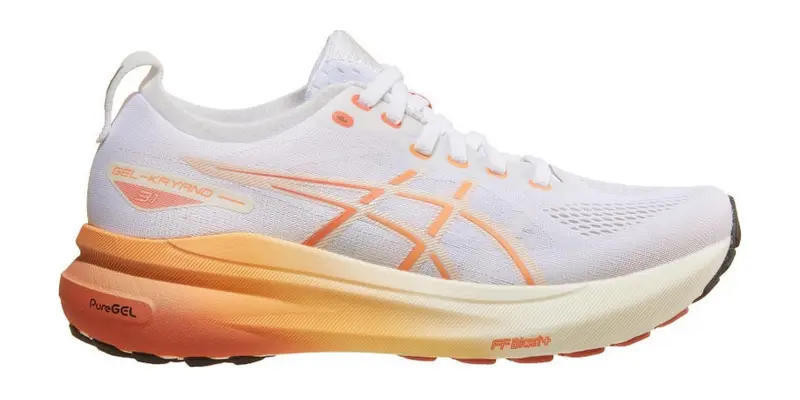
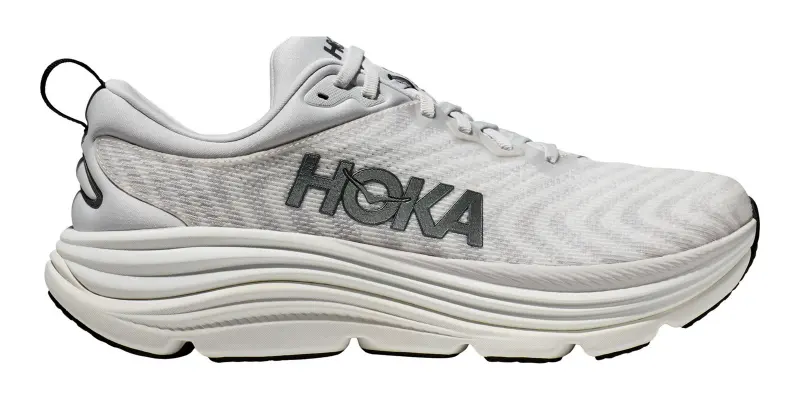
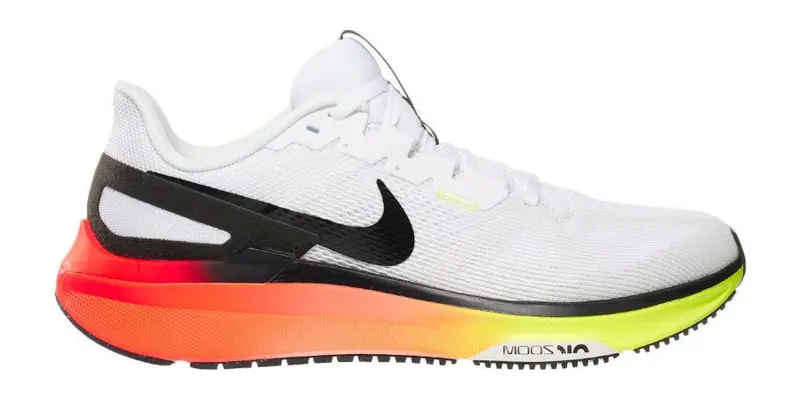
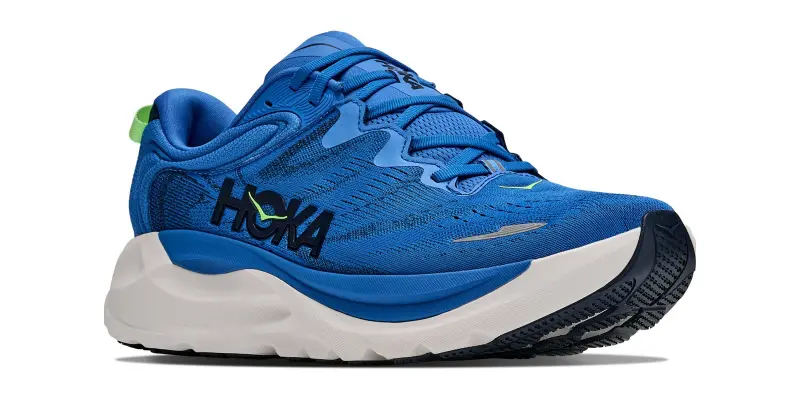
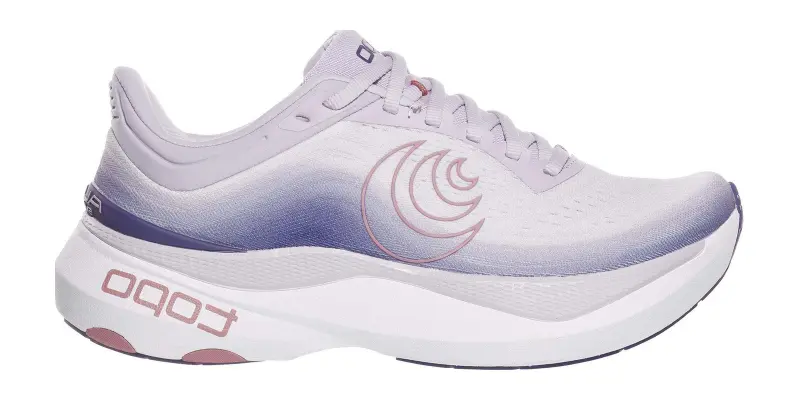
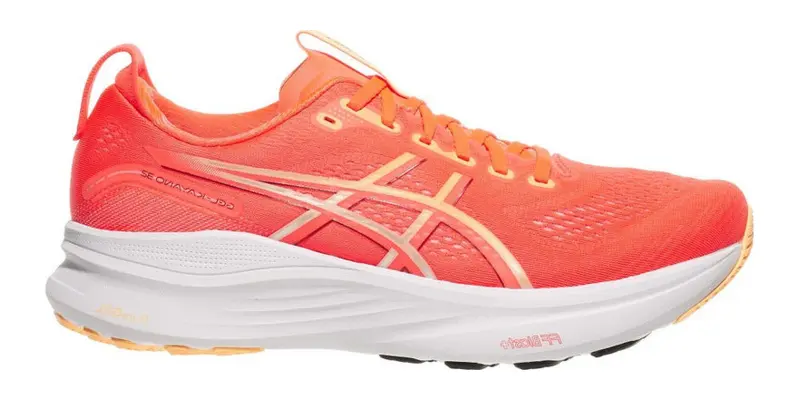
The top-rated neutral and stability shoes for sale, and their ratings.
For years, overpronators who have visited specialty running shops have been steered toward stability shoes. Overpronators' ankles roll inward on landing. Stability shoes have firmer material along the inner side of the midsole, a design intended to limit the inward roll with the goal of preventing injury. The reasoning is plausible, but evidence has never decisively been produced in support of this conventional wisdom.
We argue that despite evidence from our data showing that overpronation is associated with shoe satisfaction and injury rate, there is no strong evidence that buying a stability shoe will increase the odds that overpronators will be satisfied with their shoes or suffer fewer injuries. If anything, there is modest evidence that overpronators do better in neutral shoes: they rate them slightly higher and get injured in them less often. But these differences are so small that shoppers should simply ignore whether a shoe is categorized as neutral or stability and instead buy highly rated shoes, as we suggest in our evidence-based buying guide for running shoes.
The specific question this analysis tries to answer
The analysis that follows specifically targets this question: "Are overpronators who buy a stability shoe more likely to be satisfied and injury free than if they bought a neutral shoe?"We focus on two specific outcomes: runner satisfaction as measured by star ratings on reviews and self-reported injury rate.
We focus all our analyses in this article on overpronators, despite the fact that neutral runners sometimes buy stability shoes. One could ask whether stability shoes lead to better satisfaction for any type of runner, not just overpronators, but this is a different question than ours.
We set up all our analyses in comparison to neutral shoes because our analytic question hinges on a counterfactual: will overpronators be better or worse off in a stability shoe compared to a neutral alternative?
We constrain our analysis solely to the shoes in our data, which largely come from readers of our site and LetsRun.com.
Baseline data
We begin by analyzing some basic associations between pronation status, stability shoes, satisfaction, and injury rates. The analyses in this section are not meant to answer our research question, but to provide important context about how these factors relate to each other, which informs our later analyses.Overpronators are more likely to be dissatisfied with their shoes and get injured
Overpronation is a real biomechanical phenomenon and its effect can be seen on both shoe satisfaction rates and reported injury rates among runners.Overpronators rate shoes slightly lower than neutral runners
Mean overall star rating by pronation, across thousands of reviews.


Overpronators in our data rate shoes slightly lower than neutral runners do. The difference is small -- an average of 4.43 against 4.50 -- but the pattern holds across thousands of reviews and is not confined to any one kind of shoe.
Overpronators also report more injuries: 15% of reviews written by overpronators report an injury sustained in the shoe, compared to 10% of reviews written by neutral runners.
Overpronators report more injuries than neutral runners
Share of reviews reporting an injury sustained in the shoe, by pronation, across all shoes.


Figure 3 allows comparison of injury rates by shoe type among runners of the same pronation status. Stability shoes do not appear to prevent injury. Compared to neutral shoes, self-reported injury rates are 3.8 percentage points higher in stability shoes among overpronators, and 5.0 percentage points higher among neutral runners.
Injury reports by runner and shoe type
Share of reviews reporting an injury sustained in the shoe. Each line runs from a group's injury rate in neutral shoes to its rate in stability shoes.


Stability shoes get rated worse by both neutral runners and overpronators
Stability shoes rate worse in general, as shown in Figure 4. Across every runner in our data they average 4.42 stars against 4.50 for neutral shoes, a gap of 0.08 stars.Shoe ratings by shoe type vs. runner pronation


There are two potential explanations for this:
- Stability shoes themselves are worse.
- Overpronators rate all shoes worse because of their biomechanical differences, which we address above.
A keen-eyed reader may notice that overpronators penalize stability shoes less than neutral runners. This tells us that neutral runners should not buy stability shoes. But it also suggests there is something to the differences in neutral and stability shoes that affect overpronators' satisfaction. We must keep in mind, however, that just because overpronators penalize stability shoes less does not mean they are better off in stability shoes instead of their neutral alternatives.
Analysis results
Below, we present the results of five separate analyses, each of which helps us answer whether overpronators are likely to benefit from purchasing stability shoes instead of neutral ones. We start with a naive analysis and explain its limitations. We then move to more sophisticated analyses that take advantage of statistical methods designed to help us make cautious causal claims using non-experimental data like ours.Analysis 1: Naive comparison of outcomes in neutral vs. stability shoes among overpronators
Our first analysis is a naive comparison of the ratings and injury rates of overpronators by shoe type.Differences in overpronators' shoe ratings and injury rates by shoe type


Figure 5 shows that overpronators in our data rate stability shoes 4.40 stars against 4.46 for neutral shoes, a difference of 0.06 stars. They also report an injury in them more often: 16.5% against 12.8%, a gap of 3.8 percentage points. Both differences are statistically significant.
This provides preliminary evidence that overpronators do not fare better in stability shoes, but it is not definitive. It could be that the overpronators who buy stability shoes instead of neutral shoes are systematically different. For example, maybe overpronators who do not typically get injured are more likely to buy neutral shoes, while those who are injured often are more likely to buy stability shoes. This would bias our judgment of stability shoes.
Analysis 2: Comparing ratings of single runners who ran in both neutral and stability shoes
Runners in our data have often reviewed several shoes. We can therefore find reviewers who have run in both neutral and stability shoes. We can therefore compare the experience of these runners in stability vs. neutral shoes. By comparing results within a single person, we are able to hold the individual traits that may explain why someone chooses a stability shoe over a neutral shoe constant.Difference in shoe ratings and injury rates among the same runner, stability vs. neutral shoes


The data above show that overpronators who reviewed both neutral and stability shoes rate stability shoes 0.15 stars worse than neutral shoes. On the other hand, the same runners suffered injuries 0.4 percentage points less often when they were in stability shoes, a result in favor of stability shoes. For both outcomes, however, the confidence intervals are wide and cover zero. This means there is too much uncertainty to confidently claim that the experience of overpronators in neutral vs. stability shoes substantially differs.
This is a strong design, but it is limited by its scope: it is based upon only 127 reviews from 42 runners.
Analysis 3: Use statistical weighting to mimic a randomized trial
We previously described how overpronators who choose to buy stability shoes may be systematically different from those who buy neutral shoes. To address this problem, we can imagine conducting a randomized controlled trial. In such a trial, we could assign overpronators to buy neutral or stability shoes at random. Then we could give them money to buy a shoe at a specialty shop, wait three to six months, and then collect these runners' judgments of their shoes. We would then be able to determine whether overpronators who purchase stability shoes are better off than those who buy neutral shoes.Randomization is an effective tool in scientific investigations because it ensures that there is nothing about the runner him or herself that could systematically cause the ratings to differ, such as overpronators who buy stability shoes being harsher judges because they are more prone to injury. The propensity for being prone to injuries, as well as all other traits, would be balanced across groups due to randomization.
In this analysis, we try to mimic an experimental design. To do so, we use the profiles of runners to create a group of overpronators who ran in stability shoes that are as close as possible to a group of runners who ran in neutral shoes on everything we measure: sex, foot strike, age, weight, weekly mileage, average training pace, years running, proneness to injury, and whether the runner wore orthotics. We do this using a statistical procedure called weighting. An advantage compared to Analysis 2 is that we leverage far more data: we use 2,749 reviews from 2,568 runners.
Difference in shoe ratings and injury rates among comparable overpronators, stability vs. neutral shoes


This approach suggests that overpronators who reviewed stability shoes rated them 0.06 stars worse than otherwise equal runners who reviewed neutral shoes. This difference is statistically significant, though the confidence interval only barely excludes zero. In this analysis, overpronators in stability shoes were injured 4.2 percentage points more often than those in neutral shoes; this difference is statistically significant.
The rating difference here is smaller than the one in Analysis 2, and the injury difference points the other way: these data associate stability shoes with slightly higher rates of injury than neutral shoes.
Analysis 4: Use statistical adjustment to compare otherwise equal runners
In this approach, we build a statistical model of ratings and injury rates using every review at once, from neutral runners as well as overpronators. We model satisfaction and injury as a function of all the individual measures in Analysis 3, as well as the brand that made the shoe. Including neutral runners does not change the question we are asking, but it does let the model learn what mileage or age or weight does to a rating from far more data than the overpronators alone provide. Where a runner did not tell us something, the model estimates the missing value rather than discarding the runner, which keeps reviews the earlier approaches had to drop.We then put a question to the model about each overpronator in our data, one at a time: what would this particular runner have said about a stability shoe, and what would the same runner have said about a neutral one? The difference between those two answers is that runner's contrast, and averaging across every overpronator results in the numbers we provide below.
Difference between stability and neutral shoes among overpronators, using statistical adjustment


The typical overpronator rates a stability shoe 0.08 stars lower than a neutral shoe. Likewise, a typical overpronator suffers 1.9 percentage points more injuries in a stability shoe than a neutral shoe. The model is fairly confident that overpronators rate stability shoes worse; the "credible interval" does not include 0. On the other hand, the model is far less sure that there is a difference in injury rates.
Analysis 5: Do any shoes dampen the negative effect of pronation on satisfaction or injury rate?
In this final analysis, we take a different approach to the question. We saw above that overpronators, in general, rate shoes worse. This is because overpronation is a real biomechanical phenomenon that leads to injury and higher rates of discomfort in shoes. Our goal in this analysis is to see if there are any shoes that dampen the effect of overpronation on reviewer satisfaction.We use product line as the unit of analysis here because there are not enough reviews per shoe to isolate a "per-shoe" pronation effect. This analysis can be viewed as providing a "per product line pronation effect."
Overpronation effect by product line, compared to the average product line


The first thing to note is that there is no substantial difference between stability product lines and neutral ones. The two groups differ by 0.008 stars, effectively equal. Both groups contain product lines above and below average, and the spread within each group is about the same. No shoe type is systematically better at dampening the negative overpronation effect.
Product lines do differ from one another, however. The model estimates the spread between them at 0.07 stars, and is confident that the variation is real, not noise. Something about a product line does change how overpronators review it. We think this relates to shoe quality and comfort in general, not to whether it is a stability or neutral shoe.
What we cannot say is which product lines are genuinely better for overpronators. The credible interval of every product line contains zero. The best product line, HOKA's Bondi, sits 0.08 stars above average and the worst, Mizuno's Wave Rider, 0.09 below. The uncertainty around any single product line is several times the distance between them.
Most importantly for shoppers, the variation we do see is evenly mixed across stability and neutral shoes. Picking a stability shoe to reduce the negative overpronation effect is not going to help, although it will not hurt either. It follows that runners would be better off -- as we suggest in our evidence-based buying guide for running shoes -- buying highly rated shoes, regardless of whether they are categorized as neutral or stability shoes.
Our data is not rich enough to support doing this analysis for injury rates.
Conclusion
These analyses provide modest evidence that overpronators are more likely to prefer a neutral shoe to a stability shoe and are slightly less likely to become injured in neutral shoes. These differences are modest, but nearly every analysis points the same way, which is good evidence that overpronators should **not** seek out stability shoes, although they have no strong reason to avoid them, either.For this reason, we do not recommend that overpronators seek out stability shoes. Instead, they should seek out a well-reviewed shoe, and prefer one similar to a shoe that has worked for them. Our evidence-based buying guide for running shoes explains our recommended approach to shoe buying.
Data are accurate as of September 8, 2026. Numbers may differ slightly as new reviews come in. We periodically update these articles to stay in sync.