Will next year's version of your favorite running shoe be as good?
Brands revise their shoes every year or two. We examine whether shoes maintain their quality.
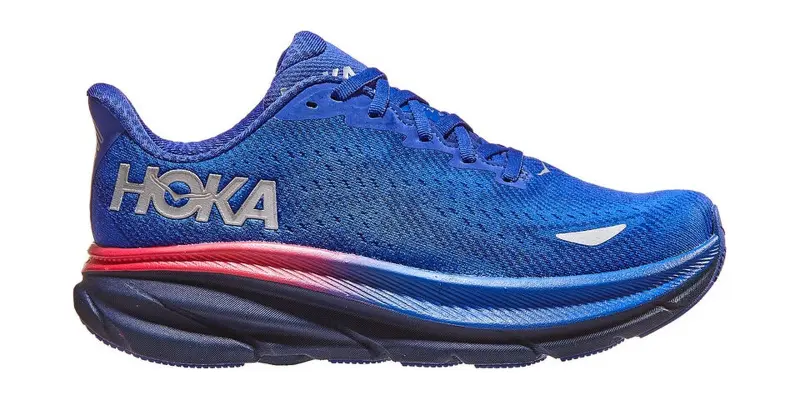
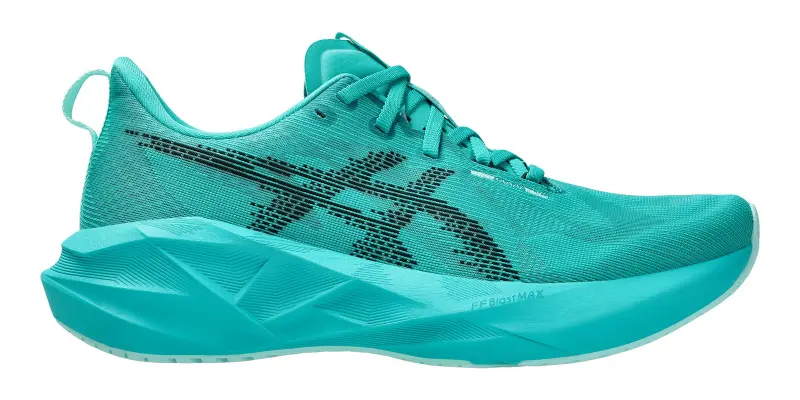
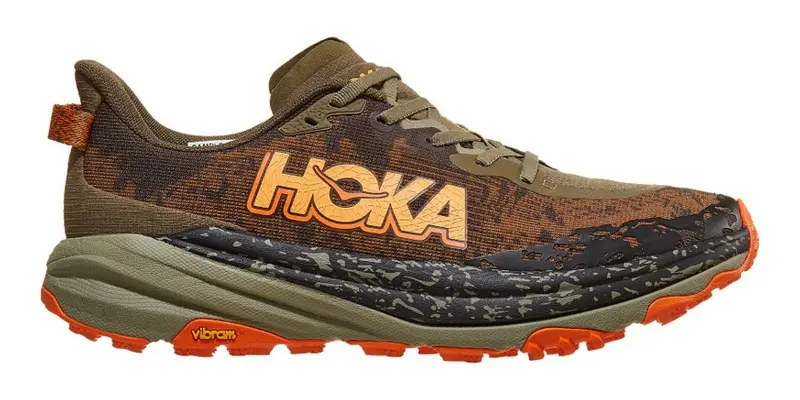
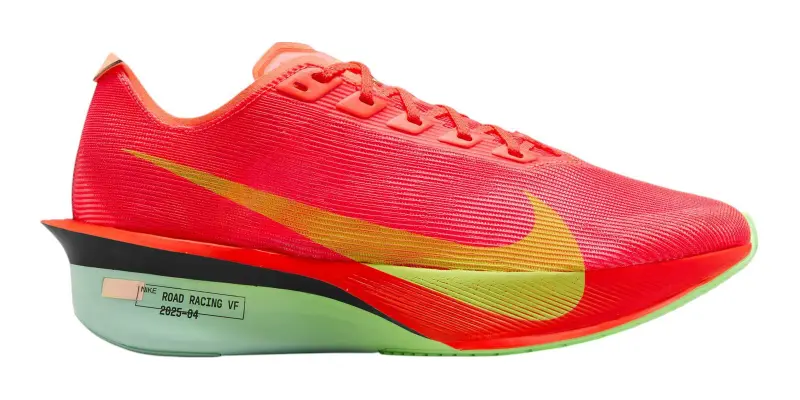
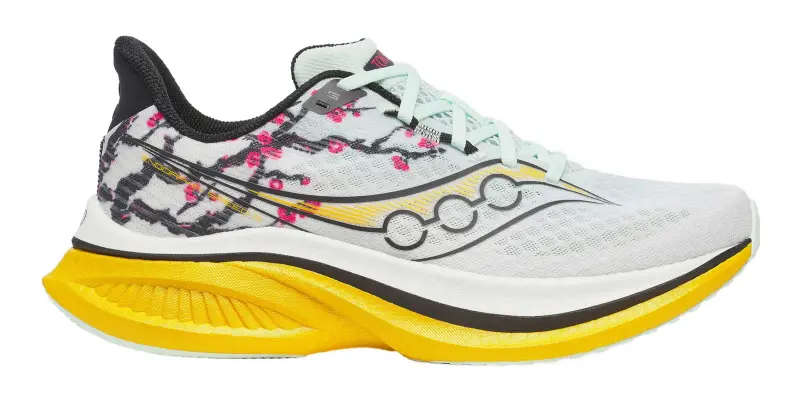
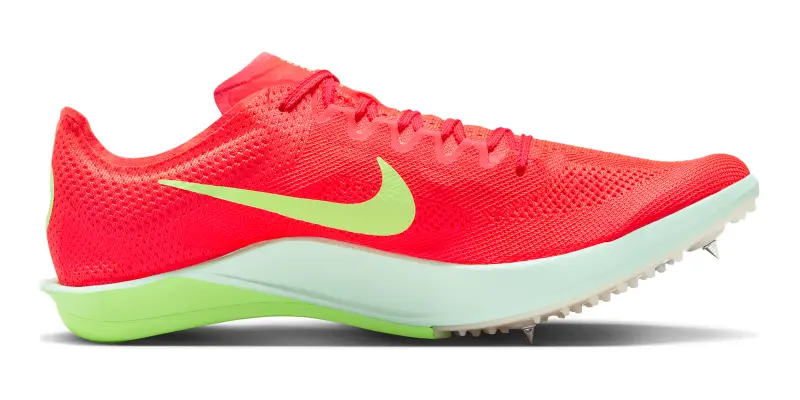
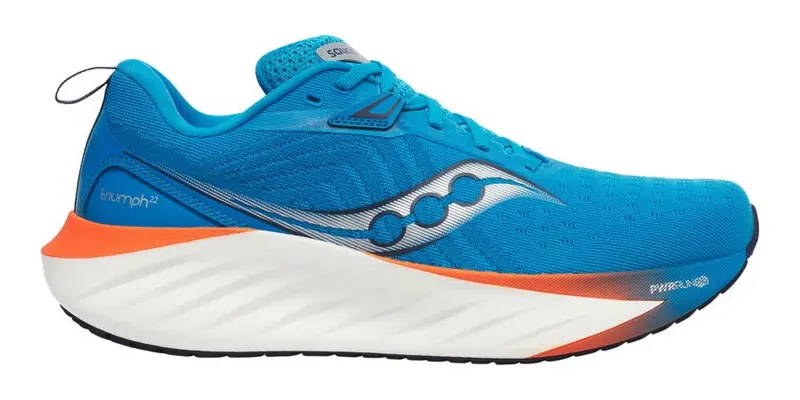
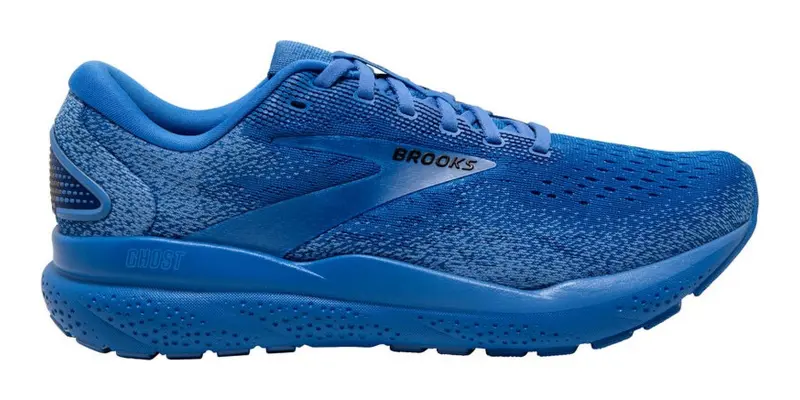
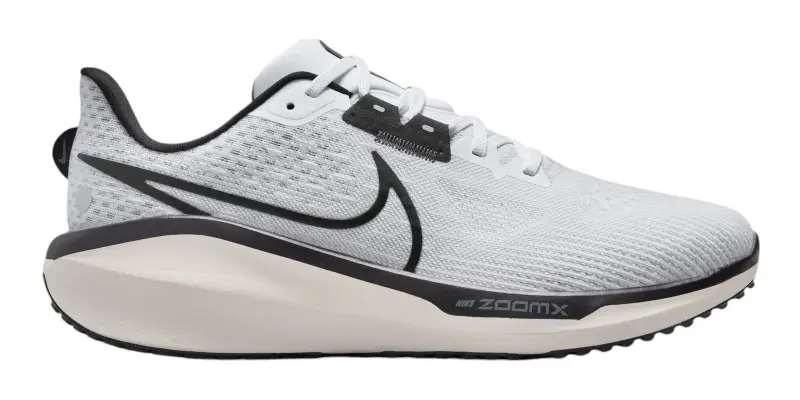
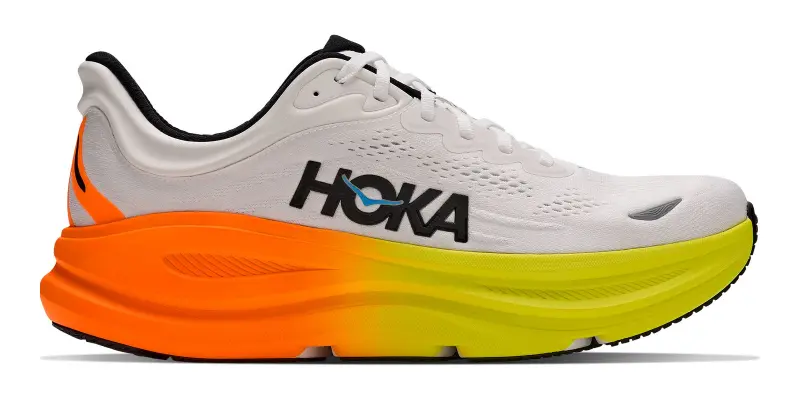
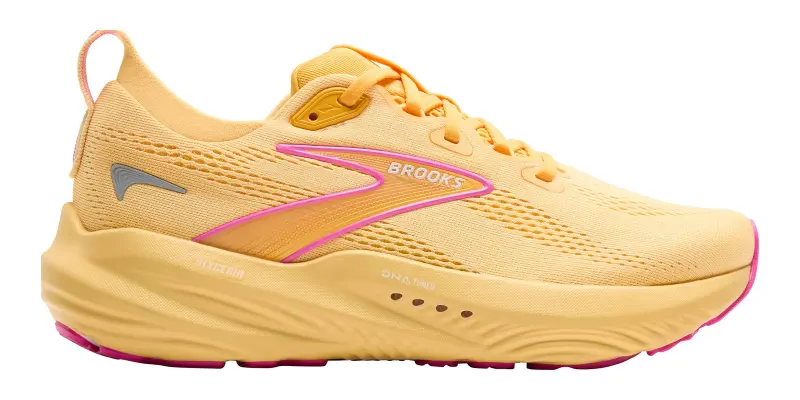
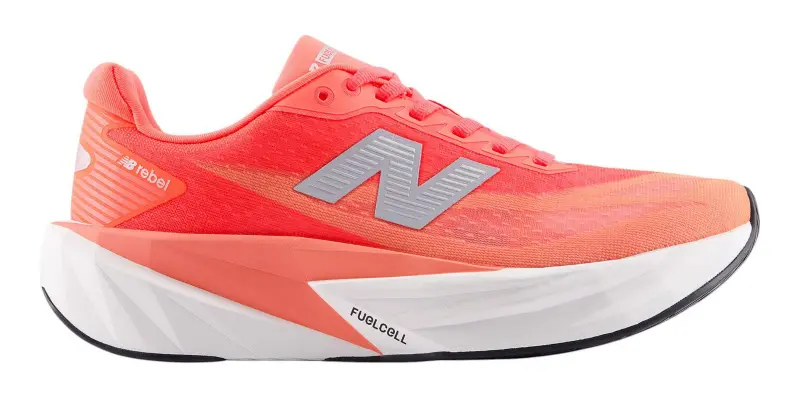
Each product line's top-rated shoe for sale, from the lines we hold five or more shoes of.
Shoe brands constantly revise their shoes, including even those with a die-hard following. Sometimes, runners are rewarded, other times they get burned. Three examples show why. First, consider the Nike Vaporfly, which debuted with the Vaporfly 4%, improved substantially with its first revision, the Next%, and has never dropped since.
Nike Vaporfly ratings by version
Each version’s Better Shoes Rating, oldest first.


Compare this to the Nike Pegasus product line, which has continually frustrated runners with its inconsistency. For example, the Pegasus 36 was a top-rated shoe, with a score of 94. The next year, they released the Pegasus 37, which rated a dismal 64. Since then, the shoe's quality has recovered into the middling range.
Nike Pegasus ratings by version
Each version’s Better Shoes Rating, oldest first.


Lastly, consider the HOKA Clifton series. The original version was widely popular and well-reviewed, scoring a 98. Scores lagged a little, but the Clifton 4 proved to be a disaster compared to its reputation, scoring only a 70. Since then, the shoe has rated consistently well, with the Clifton 9 being one of the most popular and highly rated shoes in our entire database.
HOKA Clifton ratings by version
Each version’s Better Shoes Rating, oldest first.


These three case studies demonstrate what most runners have learned through experience: quality varies within a shoe's product line.
In this article, we test that intuition against the data. We hope to help shoppers have a better understanding of how much quality persists through most shoes' product lines so they can use this knowledge, alongside our ratings database, to improve their shoe-buying decisions. The product line, we will show, is the best quality indicator available for a new shoe whose quality is not yet known.
Consecutive versions of shoes rate alike
Across 77 pairs of consecutive versions where both versions carry at least 25 reviews, the correlation between one version's average rating and the next is 0.54. A version that rates in the top half of the catalog is followed by another top-half version 69% of the time, where chance alone would rate in the top half only half the time.Relationship between star ratings of versions one, two, and three generations apart
Raw review averages, before any modeling.


Figure 4 also demonstrates what happens as versions drift apart. The correlation falls to 0.28 two generations apart and 0.20 three apart. A runner who liked the previous version has better evidence about the next revision than those generations apart.
Runners who rebought within a product line preferred the new version
Our cleanest evidence comes from 806 reviews where the previous shoe was an earlier version of the same product line and the runner rated which one was better. 54% of reviewers rated the new version better, while 34% rated the old one better, a net of +20 points in the new revision's favor.Buying a shoe within the same product line leaves runners as or more satisfied than the prior version 66% of the time.
Verdicts from runners who rebought within a product line
Each dot represents the share of reviewers giving that verdict, from reviews where the previous shoe was an earlier version of the same product line.


Next year's version usually rates higher
Across those same 77 pairs, the new version rates higher than the one it replaced 57% of the time, and falls more than ten points from its previous score only 18% of the time. The usual outcome for a new shoe is a modest improvement in rating. Only about one revision in seven is a real step down in measured quality.Last year's version is also a sound buy
Runners switching shoes report liking the new one most of the time, whatever it is, so raw switching numbers overstate how often a change succeeds. Figure 6 shows head-to-head verdicts grouped by how much ratings typically jump when switching from one version of a shoe in a product line to any other version.Head-to-head verdicts by how far the switch jumped
From comparisons where one runner reports on both shoes, grouped by the release-year gap between them.


This suggests that buying last year's version at a discount is often a sound move, and our best deals pages rank discounted shoes by the same score shown on every shoe page.
Conclusion
Our data show that shoes within a product line typically rate similarly and in fact improve more often than not. Moreover, our data also show that buyers who shop within a product line are overwhelmingly satisfied with their new shoes. For this reason, we are comfortable recommending to runners that if the previous version worked and the new version rates well, buying it again is often a good decision. If possible, the best move is not to be an early adopter of a shoe; wait and see how the reviews look. If they're positive in comparison, this provides even more basis to shop within the product line. Lastly, if the previous version worked and the new version rates poorly, a discounted purchase of the old revision makes a lot of sense.Data are accurate as of September 8, 2026. Numbers may differ slightly as new reviews come in. We periodically update these articles to stay in sync.