Are expensive running shoes better?
We measure what runners get in return when they buy expensive running shoes.
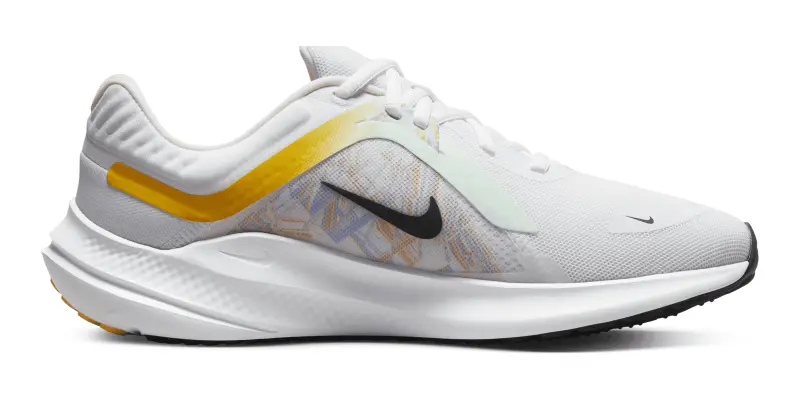
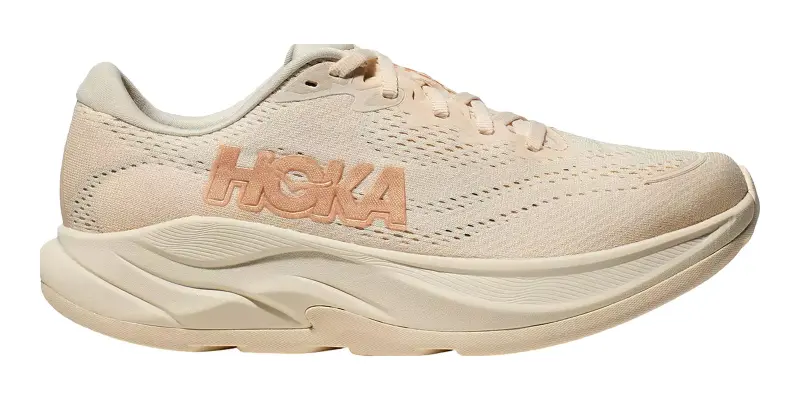
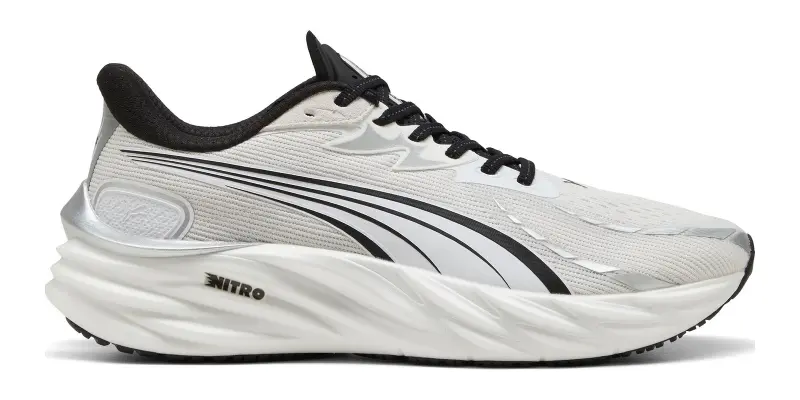
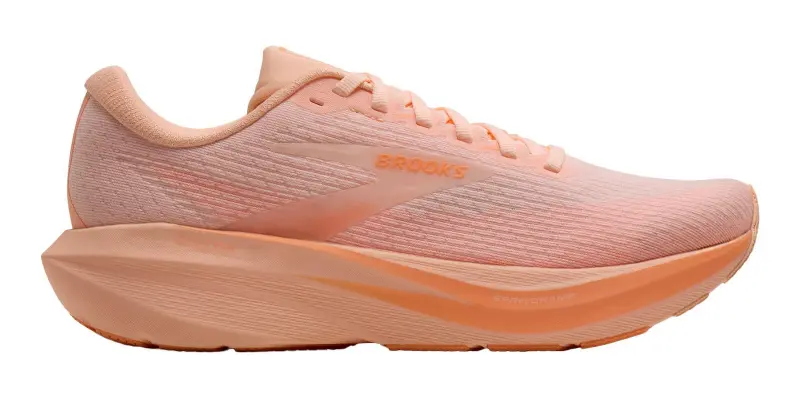
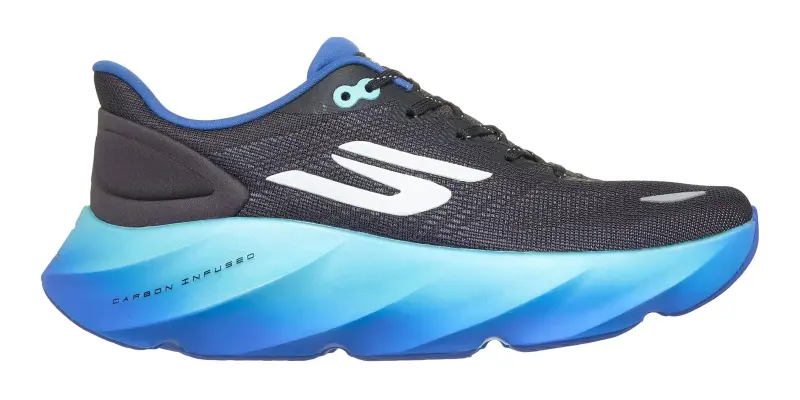
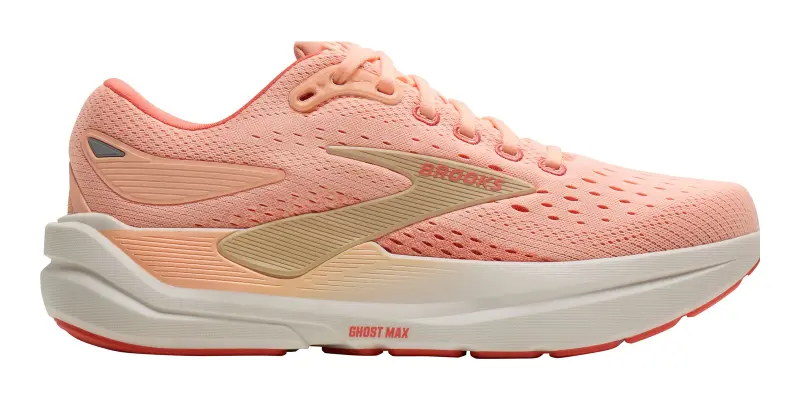
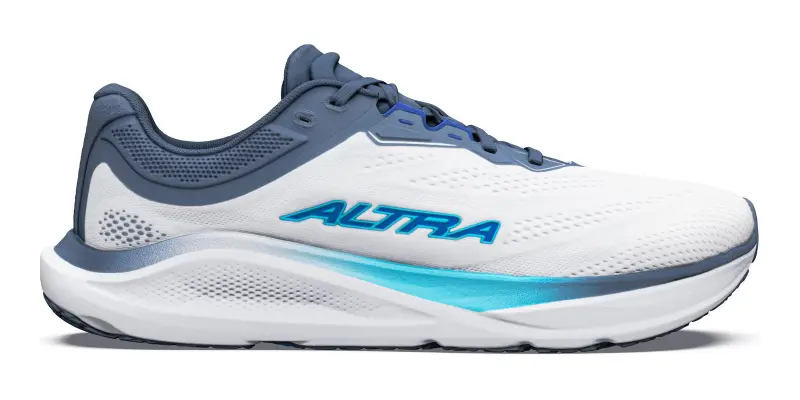
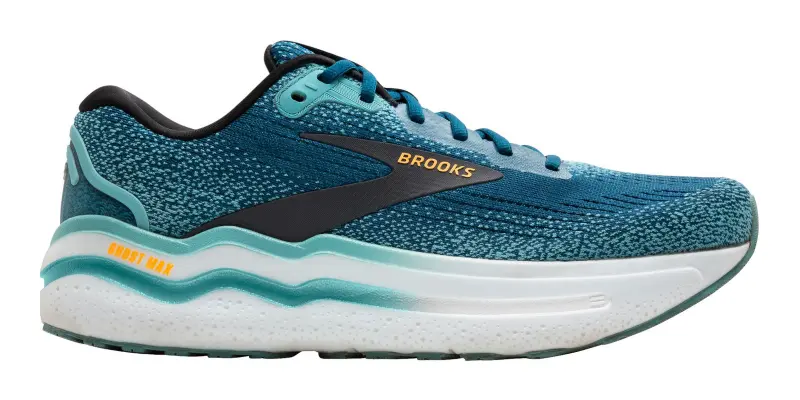
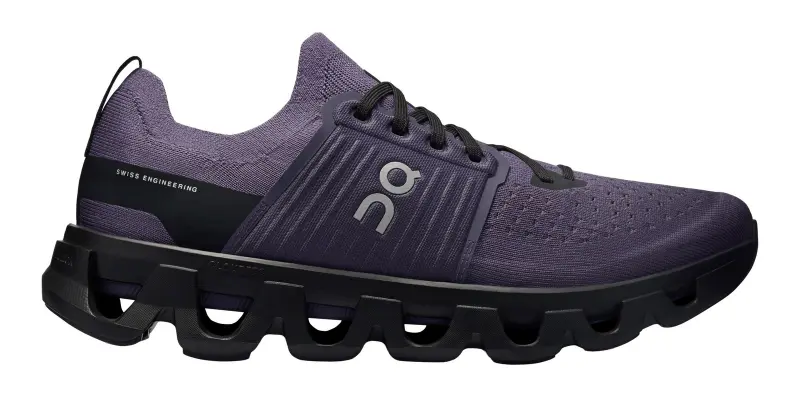
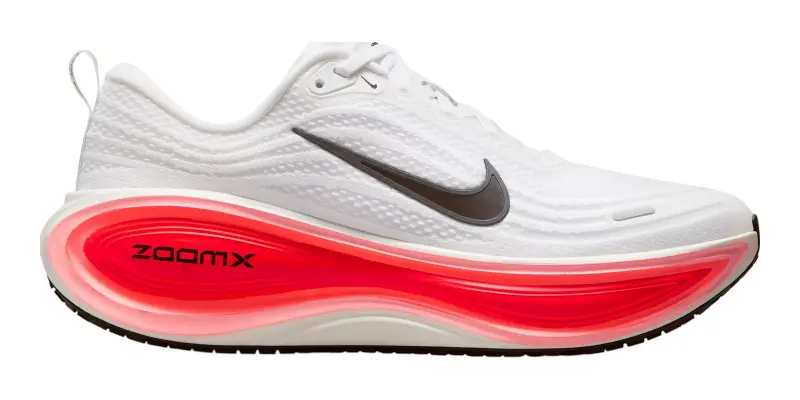
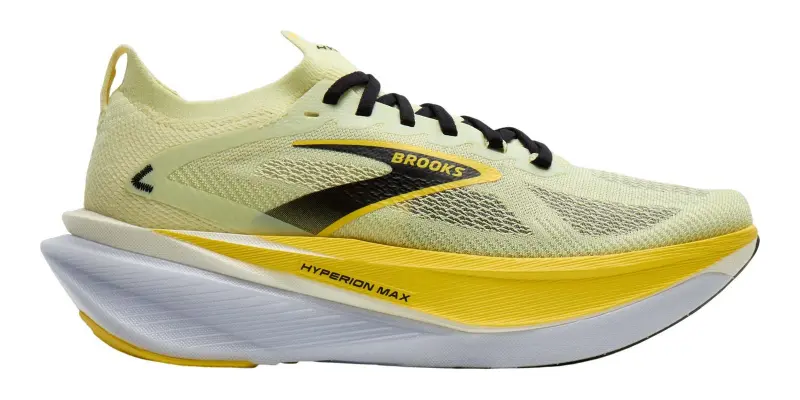
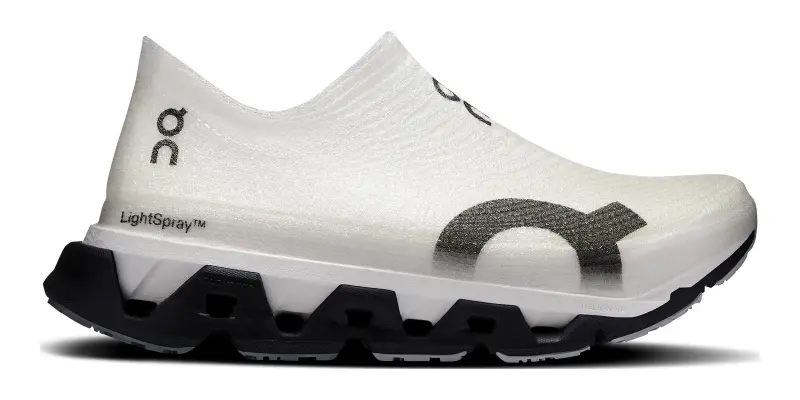
Everyday trainers rated 80 or better, across the price range, cheapest list price first.
Running shoes cost more now than they have in over a decade, even adjusting for inflation. The top price of the everyday trainer market now sits well above $180. For this reason, it is useful for shoppers to know whether it makes sense to shell out for upmarket shoes or search for a better deal. In this article, we explore when spending more money on running shoes is likely to yield you a better shoe or when it makes sense to look down market.
All prices here are adjusted to 2025 dollars, so a shoe released in 2015 is compared at what its price would be today. The comparison covers everyday trainers only, since racing shoes and trail shoes are bought for different reasons and priced on different terms.
Spending more improves your odds of buying a good shoe
Reviewers rate more expensive shoes better. We broke down prices into three bands: $150 and under, over $180, and in between. Prices here are MSRP, the list price, not what a shoe sells for on sale. Everyday trainers in the cheapest band, $150 and under, rate a median of 76, against 78 in the $151 to $180 band and 84 above $180.The top and the bottom of each band move differently with price. The best shoes improve a small amount: the 90th percentile rises from 97 in the cheapest band to 98 above $180. The worst shoes improve a large amount: 20% of the cheapest band rates below 60, against 10% of shoes above $180.
Ratings by price band for everyday trainers
Each dot represents one shoe; the shaded box covers the middle 50% of ratings in each price band.


This tells us that paying more for a shoe increases your chances of being satisfied with your purchase, but top-rated shoes exist in all price bands. The largest benefit of paying for an expensive shoe, however, is the minimization of regret. The top band of shoes has significantly fewer duds, and so you are less likely to log miles in a shoe you dislike.
Top-rated shoes are available at every price
Figure 2 shows shoes of all prices, with those rated 90 and above in the shaded band. This representation makes clear that high quality shoes are available across the entire price range of shoes. Likewise, poorly rated shoes are not confined down market.Better Shoes Rating against price for everyday trainers
The shaded band marks ratings of 90 and above.


Runners rate expensive shoes higher on every quality dimension
Our reviewers rate each shoe overall and on several subdimensions, including a subjective judgment of its value. Ratings rise with price on every quality dimension we collect. A shoe costing $50 more gains about 0.17 stars on cushioning, and comfort, durability and appearance all move the same way.Value is the single exception. The same $50 costs a shoe about 0.12 stars there, which is what Figure 3 shows: every dimension climbing with price, and value alone falling.
How each sub-rating moves with list price
How much higher or lower runners rate the pricier shoe on each dimension among shoes $50 apart in list price.


It is worth keeping in mind that perceived value feeds into how a runner scores a shoe overall, so a pricier shoe carries a small handicap unrelated to a shoe's objective quality. We cannot say how large that handicap is, only that it works against expensive shoes rather than for them.
Conclusion
Paying more for a shoe works because price carries information about quality when a runner has nothing else to go on. On the other hand, buying inexpensive shoes is riskier, but it is far from a guarantee of dissatisfaction. Some inexpensive shoes are genuinely good: a runner buying at the bottom of the market can still find an excellent shoe, and our ratings provide one way of identifying these diamonds in the rough.Our best deals pages rank discounted shoes by the same score shown on every shoe page.
Data are accurate as of September 8, 2026. Numbers may differ slightly as new reviews come in. We periodically update these articles to stay in sync.