How we rate shoes
We use modern data science to turn real reviews from over 15,000 experienced runners into shoe quality ratings.
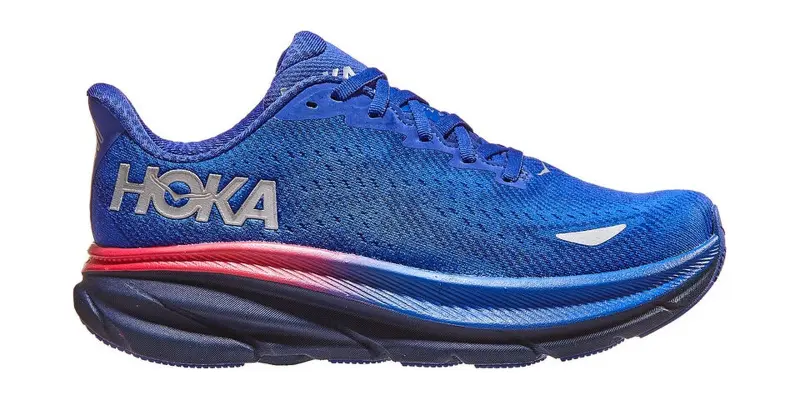
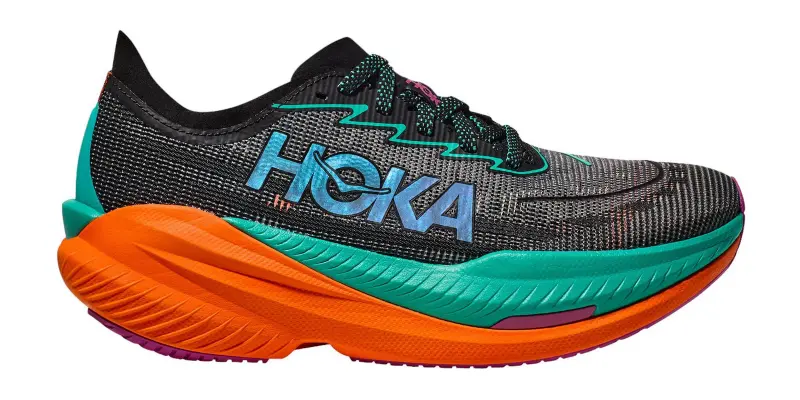
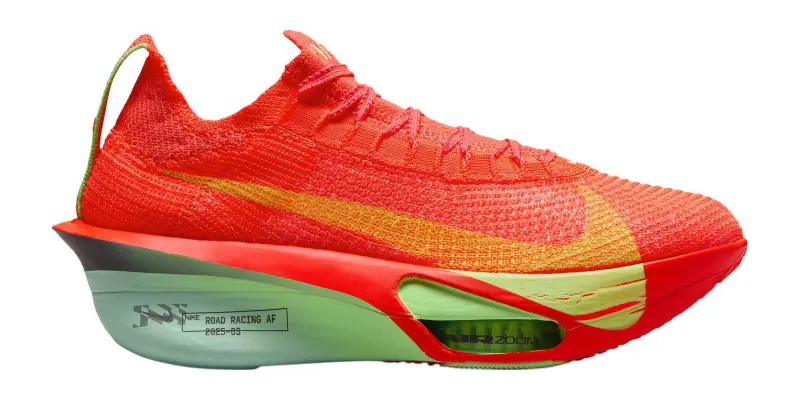
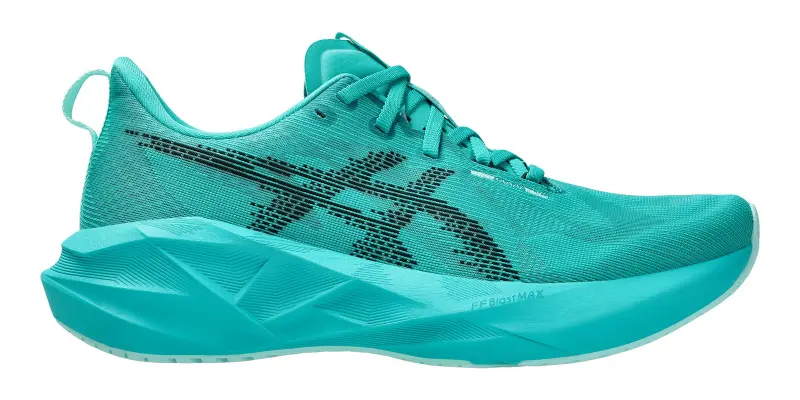
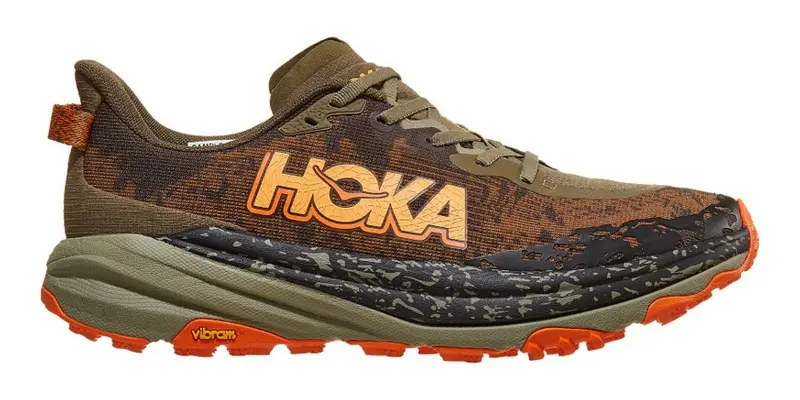
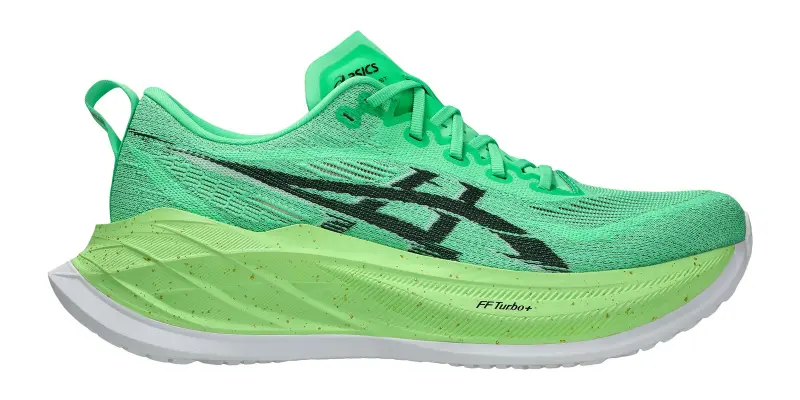
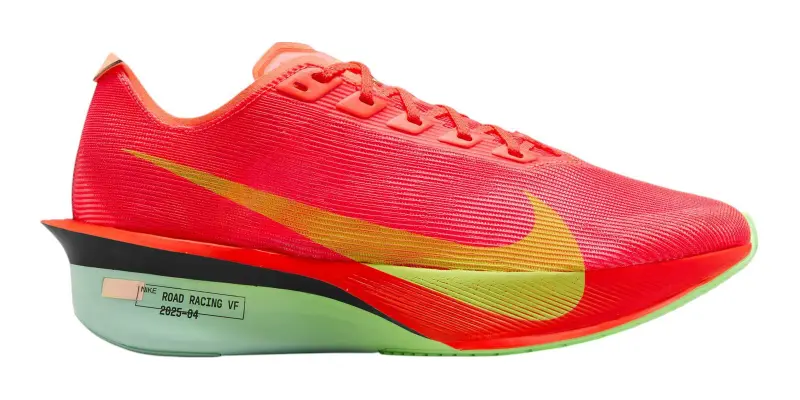
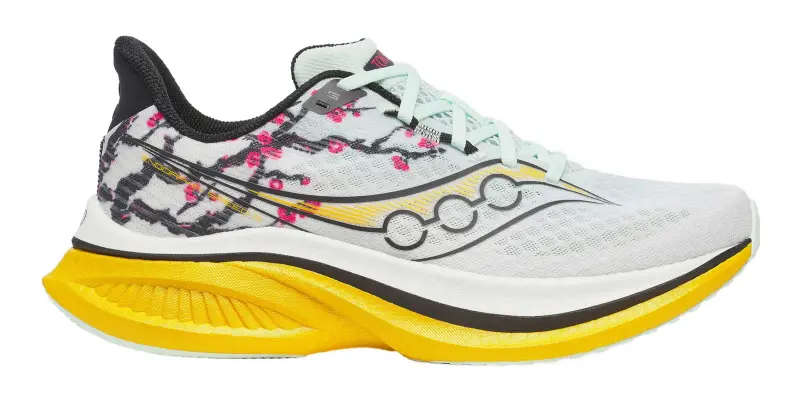
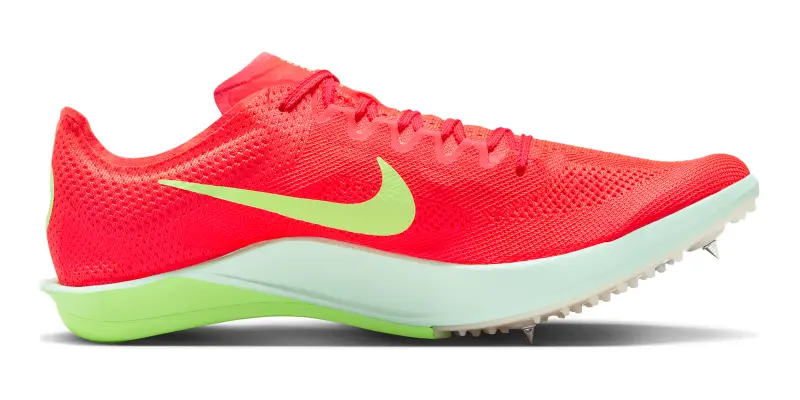
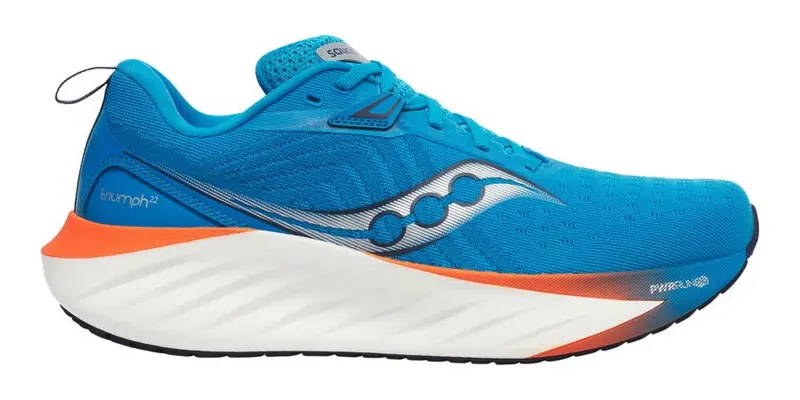
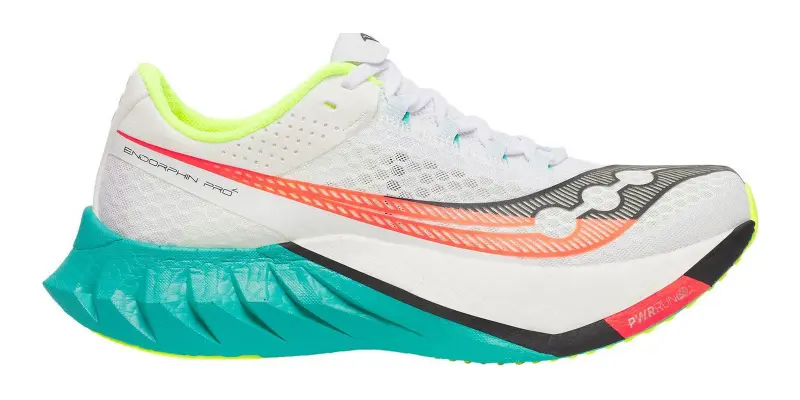
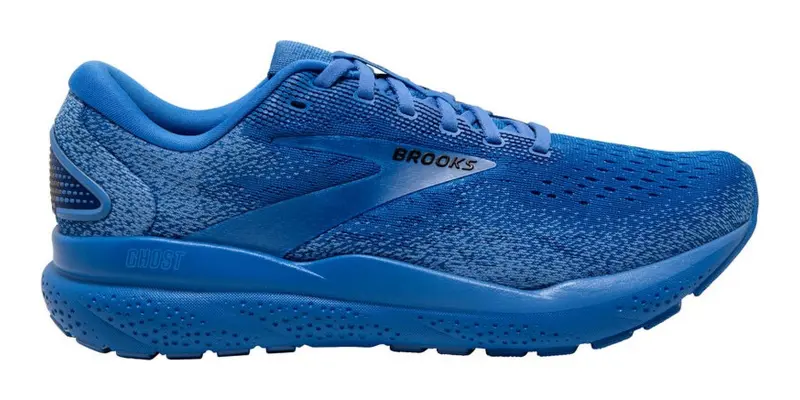
The top-rated shoes we track, and their ratings.
Running shoe buyers today have access to endless ratings and reviews: retailer star ratings by the thousand, in-depth review sites, influencers on YouTube. Experienced runners see all of this and still wonder whom to trust. How different is a 4.6 from a 4.7 when there are ten ratings? Is the charismatic reviewer sincere, and do their feet differ from yours? And above all: will this shoe work for me?
Star ratings from retail sites are a useful signal, and they are one of the inputs to our own model. Interpreting them well, however, requires context. How many ratings are there? Who left them? How are similar shoes rated? Making sense of this context is difficult for ordinary buyers. Our model, however, combines information from retailers, ratings from prior versions of a shoe, the star ratings of reviewers, and head-to-head comparisons of specific shoes. This information is then used to generate a quality rating. Modern statistical methods make this possible.
Every major sports team now uses similar methods to figure out who deserves large salaries. Those teams who adopted these methods first have won championships and changed how all major sports are coached and played. Why not apply the same techniques to shoe buying? Our model lets you do just that. We think it's a much better way to pick a shoe than relying on the judgments of only a few reviewers, however sincere and knowledgeable those reviewers are.
We are able to provide you this information because we have been collecting detailed shoe reviews for over ten years from some of the most knowledgeable and experienced runners in the world — over 15,000 so far, from LetsRun.com readers and visitors to this site. Different from retailer ratings, these reviewers rate sub-dimensions of shoes like comfort and durability, directly compare each shoe to other pairs they've run in, and tell us about themselves: whether they overpronate, how much mileage they run and how fast, whether they're injury prone. Alongside all of this, we have painstakingly collected hundreds of thousands of outside ratings from retailers.
This has left us with one of the most in-depth and rich data sets on shoe quality in the world, allowing for higher quality shoe ratings than any other magazine, review site, or individual shoe reviewer could ever provide.
How a Rating Score is built
We realize we're making a big claim, so let us explain a little bit about why we think you should believe us.Our model reasons the way an experienced runner would, starting from what the product line has done before and revising as reviews arrive. The easiest way to see this at work is to follow one shoe through it, one source of evidence at a time. The HOKA Clifton 9 is one of our highest-rated shoes, at 99 out of 100 from 130 reviews. Its newest sibling, the Clifton 11, just landed with 3 reviews and shows 86. Here is where those numbers come from.
1. Building a baseline estimate from real data
Before any of our runners review a shoe, we have the brand (HOKA), the [product line it belongs to](/brands/hoka/clifton) (Clifton), and the aggregate ratings of the shoe from shoe retailers. We use this information to form an initial estimate. For the HOKA Clifton 9, that initial estimate was a 90. A brand-new shoe sits at this same first step: the Clifton 11, which at the time of writing had only 3 reviews, was rated an 86, because we are basing our best guess for the shoe's quality on the product line as a whole. This score is thus a forecast based upon the product line's history, but is not definitive. That is why our model gives it a relatively low confidence score of 68. (We explain confidence scores below.)The model does not naively use the last version of a score alone. It also considers the brand's reputation, although this does not contribute much to our knowledge, as our analysis of what brands predict sets out. More importantly, not all shoes have rich product line data. When little is known about a shoe's product line, the model pulls its baseline score closer to the average score of all shoes. Put plainly, our model rewards shoes with a long history of quality and is skeptical of one-hit wonders.
Lastly, while retailer ratings are informative, anyone who has scoured retailer sites' ratings will know they are often full of low quality reviews, often duplicate ratings (retailers will buy aggregated data from third parties), and sometimes straight up phony reviews. For this reason, our model rates them well below our own reviewers' ratings. Nevertheless, when a shoe is released and we have not yet collected many of our own reviews, the product line and the ratings from external sources can still combine to give readers a very good idea of how a shoe will rate.
2. Incorporating head-to-head shoe comparisons
Our reviewers are asked to compare the shoe they are rating to their previous one. This links shoes into a large network that helps us correct for the fact that some people rate generously and others harshly.Comparisons also provide crucial insight that star ratings cannot. The vast majority of star ratings, whether from external retailers or in our own data, are four or a five. This is common among reviewers of all products: people tend to buy positively-reviewed products they will like. However, this also means that qualitatively different shoes can end up with similar star averages. A direct comparison between two shoes cuts through this rating compression.
The distribution of star ratings


3. Including our reviewers' ratings
Finally, we consider how reviewers rate shoes. While it is true that most shoes are rated well, the model is able to learn a lot about a shoe's quality by how frequently a shoe is not given top marks. [The figure below](#figure-stage-ladder) shows how as reader ratings accumulate, the model converges upon a rating and its confidence increases.The HOKA Clifton 9’s rating, before and after our evidence
The gold line is the most likely quality estimate at each stage.


A reasonable concern is that a shoe from a reputable brand and highly-rated product line will always be rated highly even when changes to the shoe make it objectively worse. Our model detects the poor sentiment in the ratings and adjusts its rating accordingly, as shown in Figure 3 below, where our reviewers' ratings and comparisons lower the Nike Pegasus 41 while raising the HOKA Clifton 9.
The HOKA Clifton 9 and Nike Pegasus 41, separated by reviewer evidence
The gold line is the most likely quality estimate at each stage.


This comparison should reassure you that we don't just blindly rate shoes based upon the past version of a shoe, but intelligently use it to make our ratings not ignore useful signal, but not defer to it indiscriminately.
Uncertainty and the Confidence Score
Every rating we publish carries a confidence score on the same 0 to 100 scale. This score is designed to convey how confident or certain we are about the rating given how many reviews we have. For example, the HOKA Clifton 11 rates 86 today from 3 reviews, with a confidence of 68; the Clifton 9 rates 99 from 130 reviews, with a confidence of 100. A low confidence score means the rating still rests mostly on the product line and outside ratings and can move as reviews arrive; a high one means it rests on many reviews of the shoe itself. Among shoes with five or more reader reviews the typical confidence is 85, and the most settled shoes reach the high 90s. A low confidence score does not mean a shoe is bad. Instead, we provide this number to indicate to readers that we are less certain about a shoe's quality.Two shoes with similar estimates and different amounts of evidence
The model’s central estimate is nearly identical for both. Each panel’s title shows what we publish.


Careful users of our site will see that sometimes new shoes will have relatively high confidence scores despite having few ratings. This is a feature, not a bug. When we have some signal from external retailers, strong information from the product line, even a handful of reviews can tell our model that the shoe is likely to be similar to its last version. Of course, as reviews accumulate, our model updates itself and the confidence increases.
Converting model estimates into published numbers
The model's raw outputs are statistical estimates on a scale that would be unintuitive for most readers, so we convert them for display. Both published numbers — the rating and its confidence score — are placed on the 0 to 100 scale runners already understand, where a mid-90s shoe is among the best we have rated and a shoe in the 60s is ordinary. The conversion preserves order: a shoe with a higher estimate always receives a higher rating, and a more settled shoe a higher confidence, so putting the numbers on a familiar scale never moves a shoe past another one. Each rating also carries a label. From the top down, they are Exceptional, Excellent, Very good, Good, Average, Below average, and Bottom-tier.An evidence-based shoe-buying guide
How will you know whether any specific shoe will work for *you*? The most reliable way to end up in a shoe that works is to buy a well-reviewed shoe, ideally one similar to a shoe you already trust. Our ratings pick that shortlist and tell you how sure we are about each name on it. We will not claim to be able to pinpoint a single shoe that is perfect for you. We tested whether knowing a runner's body and habits lets us match shoes to people, and [it does not](/articles/should-overpronators-buy-stability-shoes). What you know about your own feet, and about the shoes you have already run in, is evidence we do not hold. Our ratings are the part of the decision that can be measured across thousands of runners. We hope it helps you find a good shoe.We have explained how we rate shoes. How you should buy them is its own question, and it is the subject of our evidence-based buying guide for running shoes.
Frequently asked questions
Is the overall Rating Score an average of the five sub-ratings?
No. Comfort, cushioning, durability, appearance, and value each get their own model, with the same brand-to-product-line-to-shoe structure behind them. The Overall Rating Score is modeled separately, from the overall rating runners give directly. We do however consider the sub-ratings in our overall model. The impact is very modest, but it has two advantages: it helps reconcile overall ratings that differ substantially from subratings. Moreover, it helps shoes without reviews move away from their baseline score a little more aggressively.For this reason, a shoe can rate above or below its sub-ratings, and these deviations are often insightful when judging a shoe's strengths and weaknesses.
How do you know the model works?
We use cross-validation, the standard way to test a predictive model. We build the model on one part of our data, then check its predictions against reviews it has never seen. It predicts those unseen reviews better than a simple average does. Every change to the model faces the same test: if the predictions get worse, the change was bad, and it does not ship.Who are your reviewers?
Our reviewers are mostly LetsRun.com readers. These readers tend to be more experienced and more knowledgeable than the average runner. For example, the median reviewer runs 40 miles a week and has been running for 12 years.How often do the lists update? Do you edit the numbers yourself?
The models rerun daily, and the ratings and lists they produce are published without a human step in between. Price lists follow the retailer feeds, which we fetch nightly. No one raises or lowers a shoe for a sponsorship or a commission, and the code has no mechanism for doing it. We do change the data the models read. Reviews that look fraudulent are held back or removed, and wrong specs are corrected at their source, which moves the ratings that rest on them.How do you make money?
We have no sponsorships, no paid placements, and no per-shoe incentive of any kind. We earn money when you buy through our links, and the commission pays the same whichever shoe you pick, so the only thing the ratings can be optimized for is being right. Detail in our [affiliate disclosure](/affiliate-disclosure) and [editorial policy](/editorial-policy).Is this AI slop?
No. The written reviews you read are all written by humans. We do use AI tools to help find and purge non-genuine reviews, pick out informative quotes among the dozens in each review, suggest pros and cons, and improve shoe categorizations. Our statistical models were built and are maintained by a professional data scientist/applied statistician. Every suggestion made by an LLM is tagged and reviewable by a human.Data are accurate as of September 8, 2026. Numbers may differ slightly as new reviews come in. We periodically update these articles to stay in sync.