Which brands make the best running shoes?
We explore whether any brands truly stand out among their peers.
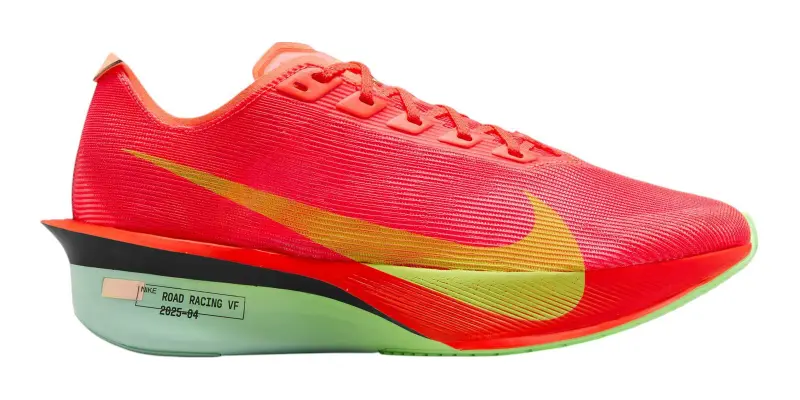

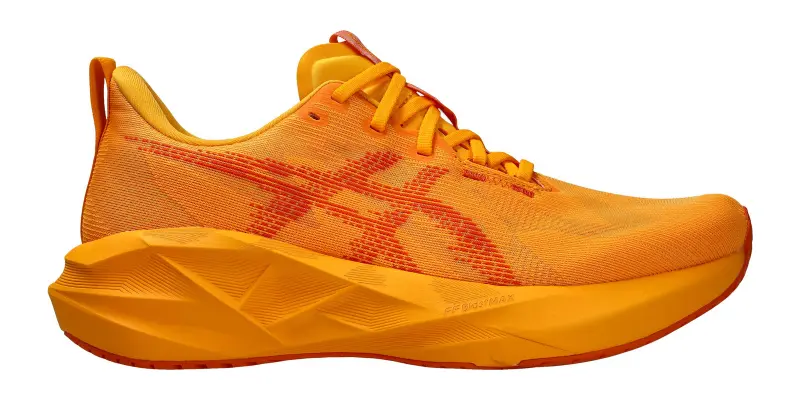
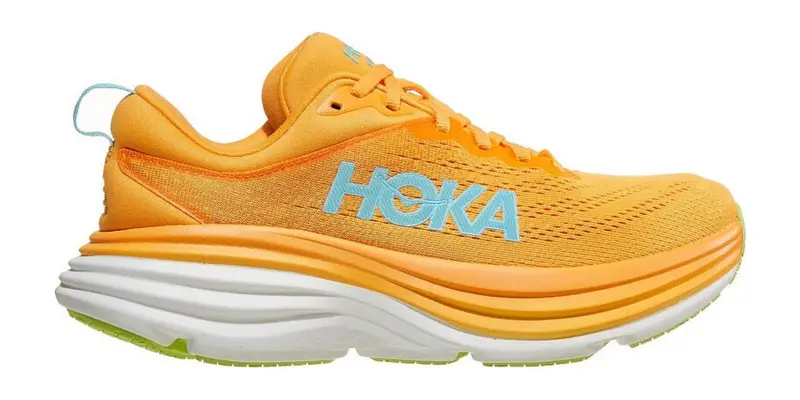
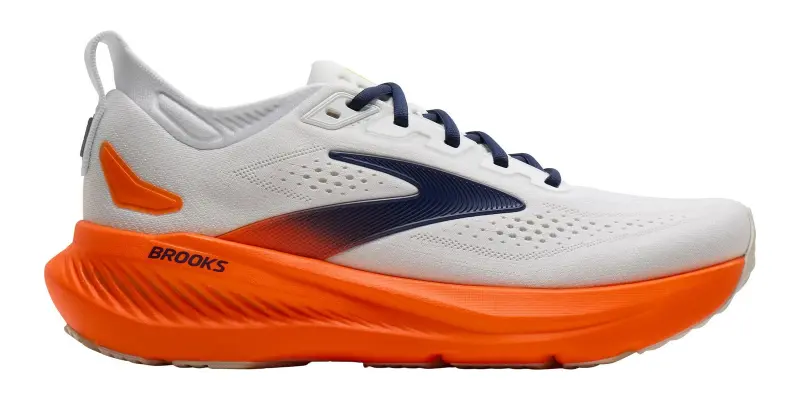
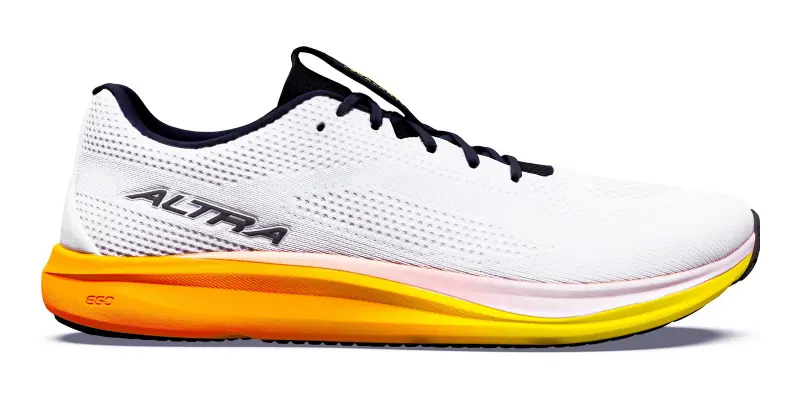
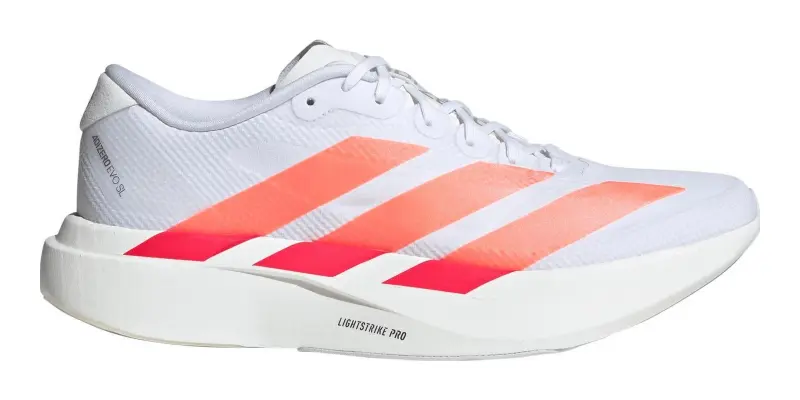
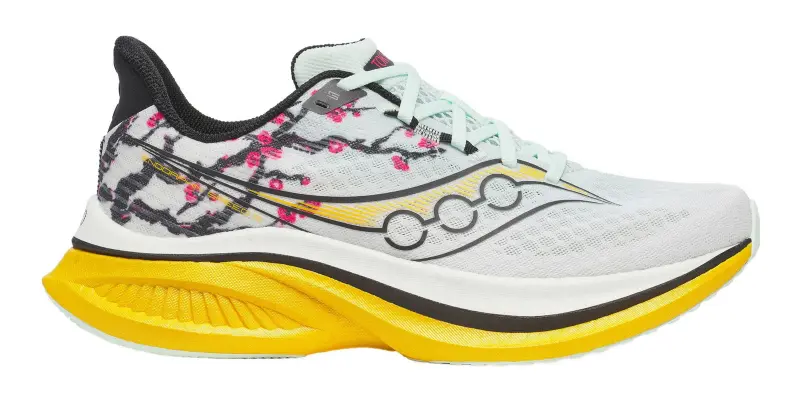
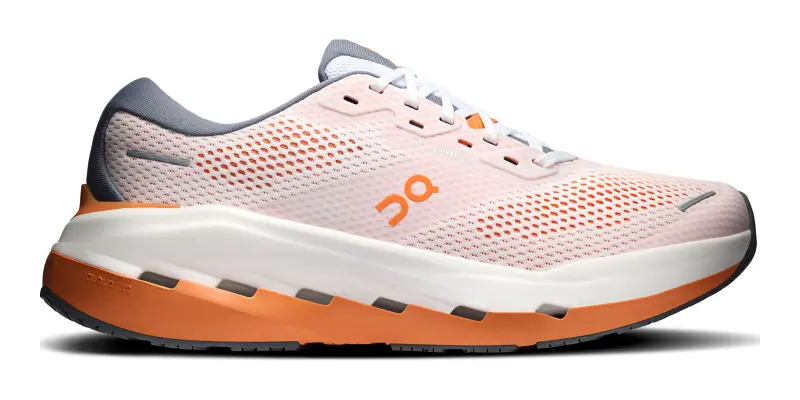
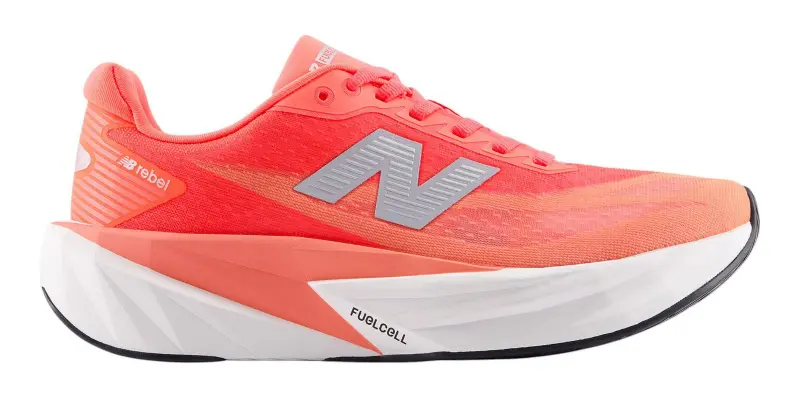
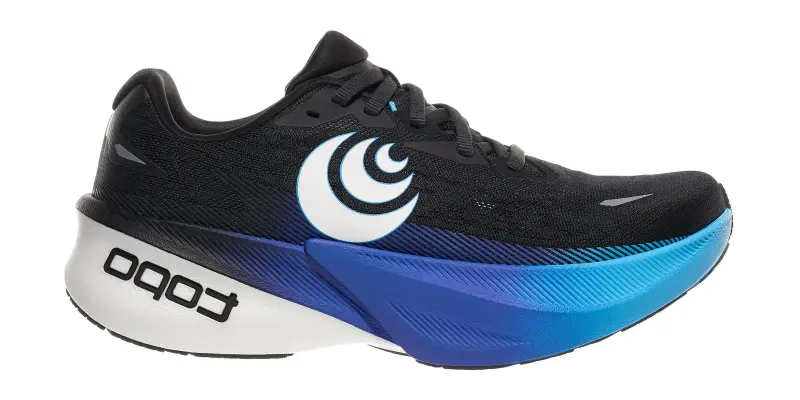
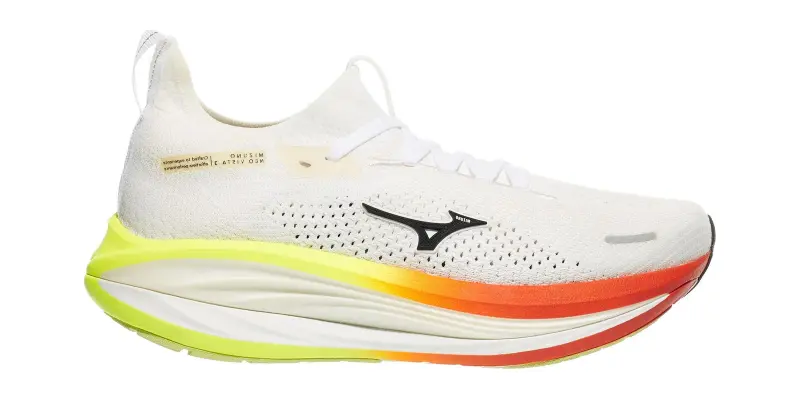
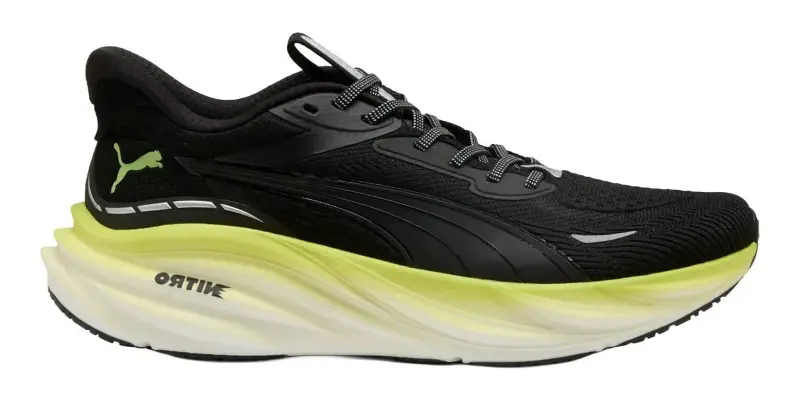
Each brand's top-rated shoe for sale, the brands with the most shoes first.
Brand loyalty is the most common shortcut in shoe buying. Runners who have a good experience in shoes from a specific brand are inclined to keep buying from that brand. In this article, we explore whether some brands truly stand out in shoe quality. We then examine whether brand is a useful basis for deciding which shoes to buy or whether there is a better approach.
On average, some brands create slightly better shoes than others
Figure 1 shows the median rating per brand (gold line) in our data against the range of all shoe ratings in that brand (dots). This figure includes every brand with at least 200 total reviews and 15 shoes with reviews. HOKA leads the pack with a median of 78.6, and the rest fall a little short of one another down to Altra at 71.2.
Every brand makes both weak and excellent shoes
Published ratings by brand. Each dot is one shoe, and the gold line marks the brand median.


While the median rating scores differ among brands, our data show that every brand produces both highly and poorly rated shoes. The brand medians themselves differ by only 7.4 points from best to worst.
A careful look at Figure 1 makes clear that the difference between brands is small next to the differences within them. A typical brand's roster spans 47 points from its worst rated shoe to its best, and the variation inside a brand is 3.8 times the variation between brands. In fact, among all 10 brands analyzed, 10 have at least one shoe rating below 60, and 10 have at least one above 90. Every qualifying brand makes both low and high quality shoes; no brand bats 1000.
The best shoes are not evenly distributed
While every brand makes good and bad shoes, some brands still dominate the top shoe rankings. To demonstrate this, we took every shoe with at least 1 review and examined the 10% of top-rated shoes by brand. 25% of HOKA's shoes fall among that top 10%. Figure 2 shows where each brand sits. Every qualifying brand places at least one shoe in this group. HOKA stands above the rest, placing 2.5 times as many shoes in the top 10% as we'd expect if there were no overall quality differences among the brands. Brooks follows at 2.2 times the expected share, and Altra places the fewest.
Some brands make more standout shoes
Share of each brand’s shoes in the top 10% of rated shoes. The vertical line marks 10%, the share if brands did not differ.


Product lines predict ratings better than brands
The wide range of shoe quality within a brand's catalog highlights why shopping only by brand is unwise. Instead, a better heuristic for shoppers is the product line (e.g., HOKA Clifton, Nike Pegasus). Of everything our model can know about a shoe before anyone rates it, the brand accounts for a rather small 1% of its rating. Knowing the product line, on the other hand, provides substantially more information. For example, the product line explains about 44% of measured variation among shoes, and the remaining 56% is particular to the specific shoe.
What this means for buyers is that about 56% of the rating of any one shoe is idiosyncratic -- it just depends on how good that year's version is. But the remaining 44% can be pinned to the product line itself. If the HOKA Clifton 9 is good, the HOKA Clifton 10 probably will be too. Of course, there are exceptions. For example, while the Clifton has consistently good shoes, the Clifton 4 was a deviation, scoring only 65, while the other numbered Cliftons rate from the high 70s to the high 90s.
Figure 3 shows why this is the case. Within the typical brand, the product lines themselves sit about 30 points apart, and several brands house both a product line rated near the top of our scale and a product line rated near 55. A shopper who knows only the brand's name has not narrowed the choice by much.
Every brand has strong and weak product lines
Product line median ratings within each brand. Each dot is one product line.


Brand loyalty has some basis when shopping, but product line loyalty is better justified, especially if one is willing to wait for reviews of new revisions of a shoe to ensure it maintains its fit and quality.
Conclusion
Choosing a well-reputed brand will in fact help you buy a better shoe, but you can do better by buying from a reputable product line: a runner who liked one version of a shoe has good reason to believe the next version will also be good. This is especially true if they personally have had a good experience in the shoe. Our data, however, do not support drawing similar conclusions within a brand.
Check out our article on whether last year's shoe predicts this year's, which explores quality consistency among product lines.
Data are accurate as of October 13, 2026. Numbers may differ slightly as new reviews come in. We periodically update these articles to stay in sync.