Have running shoes gotten better over the last decade?
We measure how much running shoes have improved over the past decade. Most of the improvement arrived as a step around 2018. We test whether the design changes of the era explain it.
Top-rated lightweight shoes
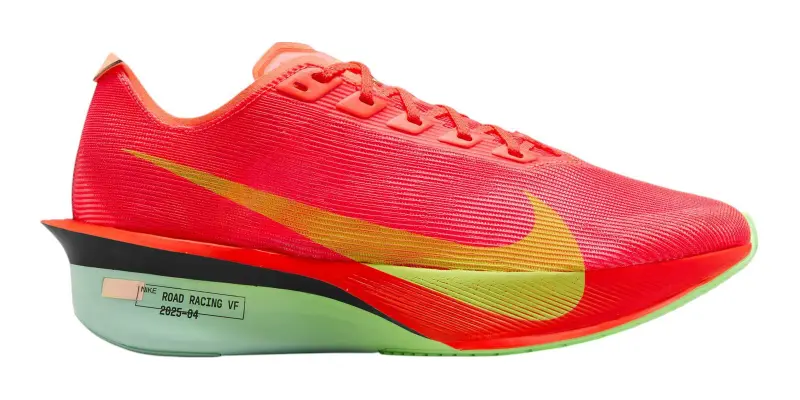


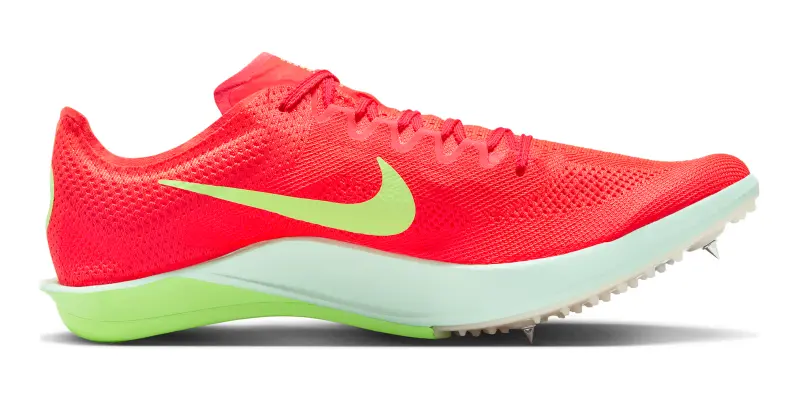
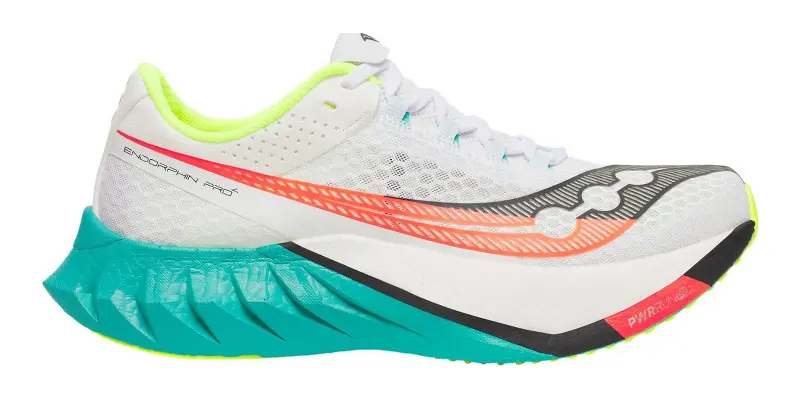

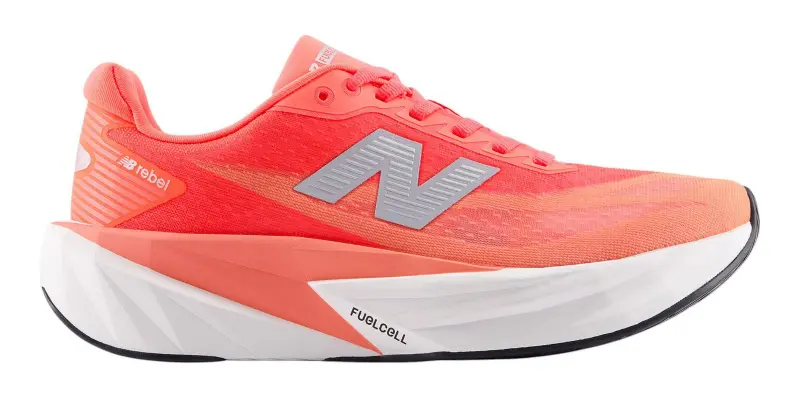
Top-rated max-cushion shoes, 40 mm heel stack or more


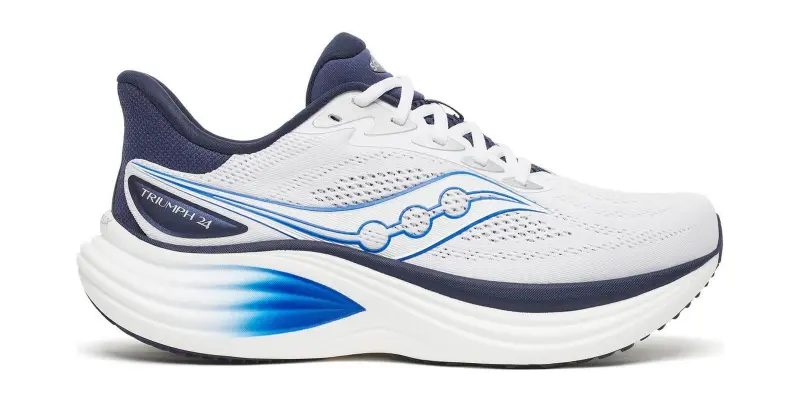
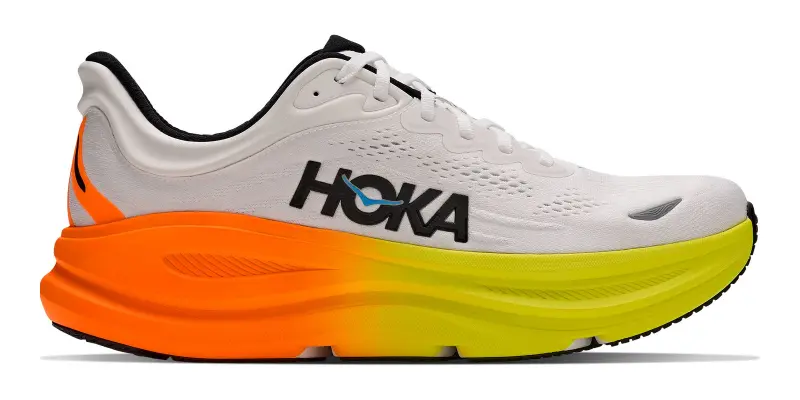
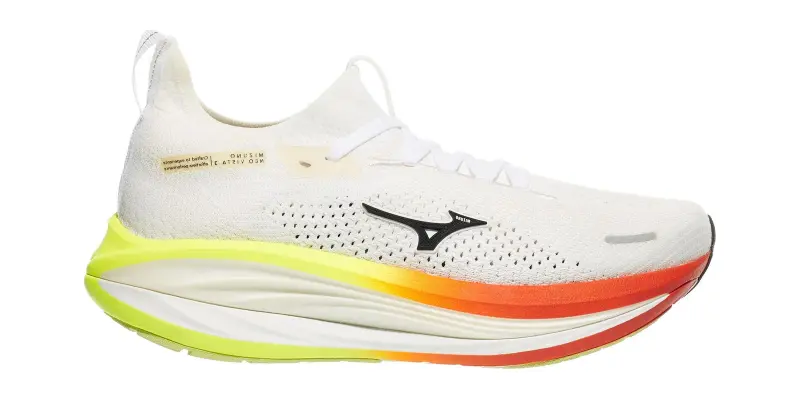
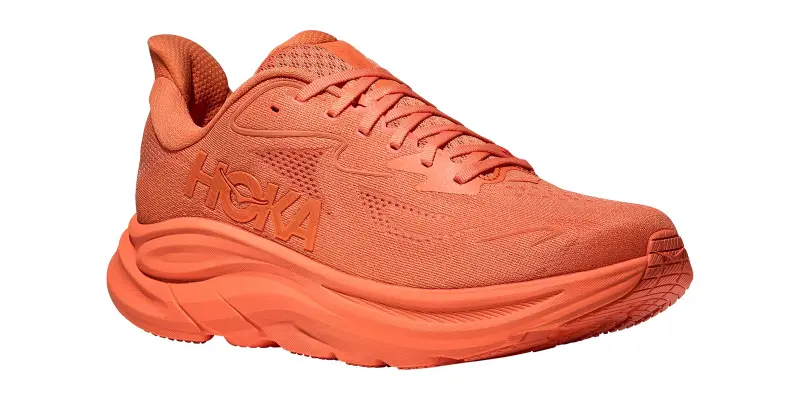
The top-rated lightweight shoes and the top-rated max-cushion shoes for sale, and their ratings.
Shoe companies always claim the new model improves on the old one. Are they telling the truth, or is this just marketing? In this article, we quantify the modest but real improvement we see in shoe satisfaction over the past decade and explore its potential causes.
Ratings over time
Figure 1 shows every road shoe with at least five reviews in our data, marking the median star rating per year with a gold bar. Measuring yearly change using 595 shoes, we find that shoe ratings have increased by 0.008 stars per year. A decade of shoe development has moved the typical rating by roughly a tenth of a star, which is a modest amount, but not trivial given that about 95% of shoe ratings are a 4 or 5.
The difference we see was not the result of a gradual change, but what appears to be a single shift. Median ratings sit near 4.43 through 2017 and then step up around 2018. They have held steady around 4.55 since.
Around 2018, shoe ratings increased
Average star ratings by release year, oldest at the bottom. Each dot is one shoe, and the gold mark is that year’s median.


Testing the hypothesis that shoe companies changed how they design shoes
An obvious explanation for this shift is that around 2018, shoe brands changed how they make shoes in a way people liked. Our data find some evidence for this: the heel stack, or amount of cushioning, a shoe has jumped considerably. Among the training shoes we rate, the median heel stack grew from about 27 mm in the early 2010s to about 36 mm in the 2020s, and supershoes went from almost nonexistent to 10% of our catalog.
In 2019 shoe stack heights started increasing
Median heel stack height of rated road shoes by release year.


We can use statistics to try to figure out if the rise in stack height and proliferation of lightweight shoes due to new materials could explain this rise. In particular, a statistical model can tell us how ratings change for shoes of the same stack height, weight, and supershoe status.
As a baseline, daily trainers' ratings increased by a modest 0.007 stars per year in our data. But examining shoes of equal stack height, weight, and supershoe status, the rating increase over time falls to 0.0020 stars per year, too small to tell apart from no change at all.
This tells us that shoes built to the same specification as shoes in past years did not get better over time. Instead, the overall rating climbed because people like shoes with higher stack height, lower weight, and carbon plates. Put another way, a 2024 daily trainer rates better than a 2014 one largely because it is a different kind of shoe.
Zooming out, the design changes account for most of the rating gain across the decade. We should note, however, that the timing does not perfectly fit. Figure 2 shows the median heel stack holding near its mid-2010s level through 2019 and then climbing only in the 2020s. At this time, supershoes were still a rounding error in the catalog. The shoes changed slightly after the ratings did. We think there is probably something to the argument that the stack height revolution drove the increase, but we are not confident enough to bet the farm on it.
Buying implications
The catalog has changed a great deal over the decade, and a shoe bought today is built differently from one bought in the early 2010s: higher stack heights have proliferated and shoes have gotten lighter. We cannot say with full confidence how much better shoes have gotten. We think probably a little bit, and probably because runners seem to prefer lightweight, high stack height shoes to alternatives. All that said, we suggest judging a shoe by its rating rather than by its release year. Whether to buy the new version or last year's takes up the purchase decision.
Data are accurate as of October 13, 2026. Numbers may differ slightly as new reviews come in. We periodically update these articles to stay in sync.